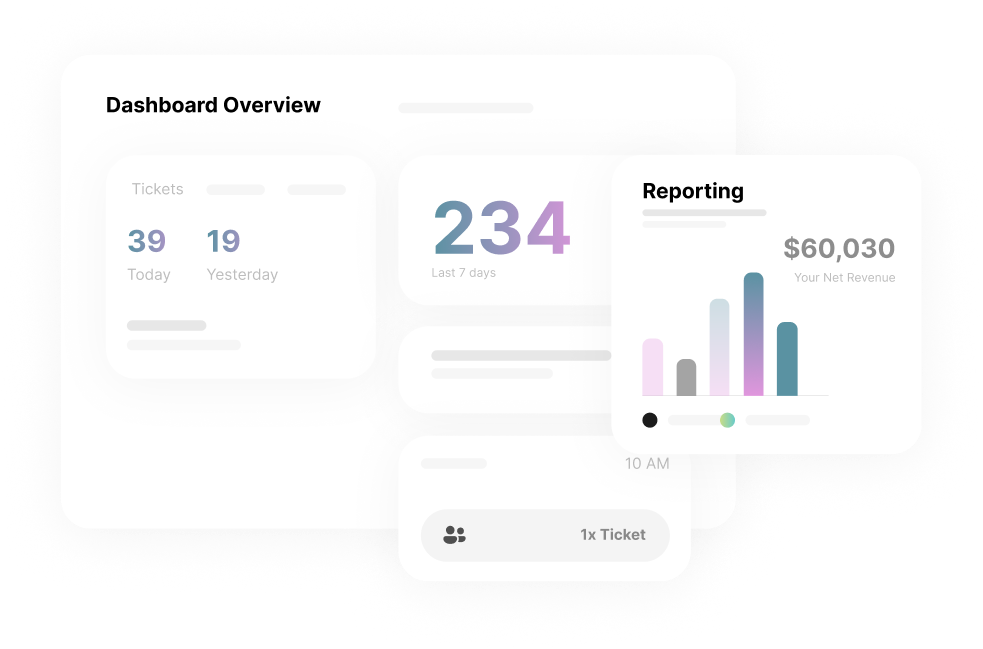
Unlock Your Industry Insights
See how businesses like yours are performing, explore key booking trends and gain insights that can help you level up your decision-making.
Tell us a bit about your business
Use the dropdowns below to tailor data to your business type and size. Based on millions of data points, we'll show you booking trends highly relevant to you.
What’s your window?
Booking across
Winter Activities
happen on average
20
days in advance
The most popular booking days for
Winter Activities
are
Friday, Wednesday, Monday
47.05
%
of bookings happen on these days
Knowing when customers book is crucial to building a profile of their needs and wants, and being able to better target them via laser-focused marketing to hit those sweet spots.
What are customers spending?
$
242.49
average order amount
This shows an average change of
+67.5
%
from last year
2.6
average number of tickets per order
This shows an average change of
-23.53
%
from last year
Consider adding additional activity options as a bundle and upselling add-ons like drinks or merch to boost earnings.
Get ahead of cancellation
Cancellations for
Winter Activities
experiences happen on average
14
days in advance
Knowing when people are most likely to bail allows you to sharpen your strategies to keep bookings locked in. Try adding in auto email reminders to generate excitement, highlight self-reschedule options and make your policy clear when booking.
Where are your customers clicking?

53.98
%

46.02
%
Locals or Tourists?
%
%
%
Where guests visit you from can affect how you market your tours. For tourists, try expanding your marketing geos, offer bundled activities together or add local recs in your comms. For locals, consider punch passes or memberships to encourage repeat business.

Industry Trends Across the Year
See how seasonality affects key sales volume, guest type and order amounts for the
Winter Activities
industry.
What’s your window?
Booking across
Tours
happen on average
24
days in advance
The most popular booking days for
Tours
are
Friday, Tuesday, Monday
44.7
%
of bookings happen on these days
Knowing when customers book is crucial to building a profile of their needs and wants, and being able to better target them via laser-focused marketing to hit those sweet spots.
What are customers spending?
$
107.51
average order amount
This shows an average change of
+23.22
%
from last year
2.8
average number of tickets per order
This shows an average change of
-3.45
%
from last year
Consider adding additional activity options as a bundle and upselling add-ons like drinks or merch to boost earnings.
Get ahead of cancellation
Cancellations for
Tours
experiences happen on average
-20
days in advance
Knowing when people are most likely to bail allows you to sharpen your strategies to keep bookings locked in. Try adding in auto email reminders to generate excitement, highlight self-reschedule options and make your policy clear when booking.
Where are your customers clicking?
37.49
%
62.51
%
Locals or Tourists?
%
%
%
Where guests visit you from can affect how you market your tours. For tourists, try expanding your marketing geos, offer bundled activities together or add local recs in your comms. For locals, consider punch passes or memberships to encourage repeat business.
Industry Trends Across the Year
See how seasonality affects key sales volume, guest type and order amounts for the
Tours
industry.
What’s your window?
Booking across
Winter Activities
happen on average
20
days in advance
The most popular booking days for
Winter Activities
are
Tuesday, Wednesday, Friday
45.9
%
of bookings happen on these days
Knowing when customers book is crucial to building a profile of their needs and wants, and being able to better target them via laser-focused marketing to hit those sweet spots.
What are customers spending?
$
514.84
average order amount
This shows an average change of
+8.99
%
from last year
3.8
average number of tickets per order
This shows an average change of
+15.15
%
from last year
Consider adding additional activity options as a bundle and upselling add-ons like drinks or merch to boost earnings.
Get ahead of cancellation
Cancellations for
Winter Activities
experiences happen on average
10
days in advance
Knowing when people are most likely to bail allows you to sharpen your strategies to keep bookings locked in. Try adding in auto email reminders to generate excitement, highlight self-reschedule options and make your policy clear when booking.
Where are your customers clicking?
66.83
%
33.17
%
Locals or Tourists?
%
%
%
Where guests visit you from can affect how you market your tours. For tourists, try expanding your marketing geos, offer bundled activities together or add local recs in your comms. For locals, consider punch passes or memberships to encourage repeat business.
Industry Trends Across the Year
See how seasonality affects key sales volume, guest type and order amounts for the
Winter Activities
industry.
What’s your window?
Booking across
Winter Activities
happen on average
12
days in advance
The most popular booking days for
Winter Activities
are
Friday, Thursday, Saturday
46.08
%
of bookings happen on these days
Knowing when customers book is crucial to building a profile of their needs and wants, and being able to better target them via laser-focused marketing to hit those sweet spots.
What are customers spending?
$
431.95
average order amount
This shows an average change of
+19.04
%
from last year
4.3
average number of tickets per order
This shows an average change of
-6.52
%
from last year
Consider adding additional activity options as a bundle and upselling add-ons like drinks or merch to boost earnings.
Get ahead of cancellation
Cancellations for
Winter Activities
experiences happen on average
6
days in advance
Knowing when people are most likely to bail allows you to sharpen your strategies to keep bookings locked in. Try adding in auto email reminders to generate excitement, highlight self-reschedule options and make your policy clear when booking.
Where are your customers clicking?
49.55
%
50.45
%
Locals or Tourists?
%
%
%
Where guests visit you from can affect how you market your tours. For tourists, try expanding your marketing geos, offer bundled activities together or add local recs in your comms. For locals, consider punch passes or memberships to encourage repeat business.
Industry Trends Across the Year
See how seasonality affects key sales volume, guest type and order amounts for the
Winter Activities
industry.
What’s your window?
Booking across
Water Activities
happen on average
20
days in advance
The most popular booking days for
Water Activities
are
Sunday, Friday, Tuesday
49.83
%
of bookings happen on these days
Knowing when customers book is crucial to building a profile of their needs and wants, and being able to better target them via laser-focused marketing to hit those sweet spots.
What are customers spending?
$
269.6
average order amount
This shows an average change of
+24.14
%
from last year
3.7
average number of tickets per order
This shows an average change of
+0.35%
%
from last year
Consider adding additional activity options as a bundle and upselling add-ons like drinks or merch to boost earnings.
Get ahead of cancellation
Cancellations for
Water Activities
experiences happen on average
9
days in advance
Knowing when people are most likely to bail allows you to sharpen your strategies to keep bookings locked in. Try adding in auto email reminders to generate excitement, highlight self-reschedule options and make your policy clear when booking.
Where are your customers clicking?
41.4
%
58.6
%
Locals or Tourists?
%
%
%
Where guests visit you from can affect how you market your tours. For tourists, try expanding your marketing geos, offer bundled activities together or add local recs in your comms. For locals, consider punch passes or memberships to encourage repeat business.
Industry Trends Across the Year
See how seasonality affects key sales volume, guest type and order amounts for the
Water Activities
industry.
What’s your window?
Booking across
Water Activities
happen on average
13
days in advance
The most popular booking days for
Water Activities
are
Friday, Monday, Tuesday
44.85
%
of bookings happen on these days
Knowing when customers book is crucial to building a profile of their needs and wants, and being able to better target them via laser-focused marketing to hit those sweet spots.
What are customers spending?
$
233.61
average order amount
This shows an average change of
+9.7
%
from last year
4.7
average number of tickets per order
This shows an average change of
+30.56
%
from last year
Consider adding additional activity options as a bundle and upselling add-ons like drinks or merch to boost earnings.
Get ahead of cancellation
Cancellations for
Water Activities
experiences happen on average
9
days in advance
Knowing when people are most likely to bail allows you to sharpen your strategies to keep bookings locked in. Try adding in auto email reminders to generate excitement, highlight self-reschedule options and make your policy clear when booking.
Where are your customers clicking?
55.43
%
44.57
%
Locals or Tourists?
%
%
%
Where guests visit you from can affect how you market your tours. For tourists, try expanding your marketing geos, offer bundled activities together or add local recs in your comms. For locals, consider punch passes or memberships to encourage repeat business.
Industry Trends Across the Year
See how seasonality affects key sales volume, guest type and order amounts for the
Water Activities
industry.
What’s your window?
Booking across
Water Activities
happen on average
12
days in advance
The most popular booking days for
Water Activities
are
Friday, Wednesday, Monday
44.76
%
of bookings happen on these days
Knowing when customers book is crucial to building a profile of their needs and wants, and being able to better target them via laser-focused marketing to hit those sweet spots.
What are customers spending?
$
186.79
average order amount
This shows an average change of
-1.83
%
from last year
2.9
average number of tickets per order
This shows an average change of
+3.57
%
from last year
Consider adding additional activity options as a bundle and upselling add-ons like drinks or merch to boost earnings.
Get ahead of cancellation
Cancellations for
Water Activities
experiences happen on average
6
days in advance
Knowing when people are most likely to bail allows you to sharpen your strategies to keep bookings locked in. Try adding in auto email reminders to generate excitement, highlight self-reschedule options and make your policy clear when booking.
Where are your customers clicking?
63.26
%
36.74
%
Locals or Tourists?
%
%
%
Where guests visit you from can affect how you market your tours. For tourists, try expanding your marketing geos, offer bundled activities together or add local recs in your comms. For locals, consider punch passes or memberships to encourage repeat business.
Industry Trends Across the Year
See how seasonality affects key sales volume, guest type and order amounts for the
Water Activities
industry.
What’s your window?
Booking across
Tours
happen on average
64
days in advance
The most popular booking days for
Tours
are
Wednesday, Tuesday, Saturday
50.76
%
of bookings happen on these days
Knowing when customers book is crucial to building a profile of their needs and wants, and being able to better target them via laser-focused marketing to hit those sweet spots.
What are customers spending?
$
179.62
average order amount
This shows an average change of
+38.98
%
from last year
3.6
average number of tickets per order
This shows an average change of
-20
%
from last year
Consider adding additional activity options as a bundle and upselling add-ons like drinks or merch to boost earnings.
Get ahead of cancellation
Cancellations for
Tours
experiences happen on average
20
days in advance
Knowing when people are most likely to bail allows you to sharpen your strategies to keep bookings locked in. Try adding in auto email reminders to generate excitement, highlight self-reschedule options and make your policy clear when booking.
Where are your customers clicking?
44.95
%
55.05
%
Locals or Tourists?
%
%
%
Where guests visit you from can affect how you market your tours. For tourists, try expanding your marketing geos, offer bundled activities together or add local recs in your comms. For locals, consider punch passes or memberships to encourage repeat business.
Industry Trends Across the Year
See how seasonality affects key sales volume, guest type and order amounts for the
Tours
industry.
What’s your window?
Booking across
Tours
happen on average
26
days in advance
The most popular booking days for
Tours
are
Friday, Monday, Thursday
45.07
%
of bookings happen on these days
Knowing when customers book is crucial to building a profile of their needs and wants, and being able to better target them via laser-focused marketing to hit those sweet spots.
What are customers spending?
$
91.15
average order amount
This shows an average change of
+0.16
%
from last year
2.9
average number of tickets per order
This shows an average change of
+0.25
%
from last year
Consider adding additional activity options as a bundle and upselling add-ons like drinks or merch to boost earnings.
Get ahead of cancellation
Cancellations for
Tours
experiences happen on average
18
days in advance
Knowing when people are most likely to bail allows you to sharpen your strategies to keep bookings locked in. Try adding in auto email reminders to generate excitement, highlight self-reschedule options and make your policy clear when booking.
Where are your customers clicking?
60.66
%
39.34
%
Locals or Tourists?
%
%
%
Where guests visit you from can affect how you market your tours. For tourists, try expanding your marketing geos, offer bundled activities together or add local recs in your comms. For locals, consider punch passes or memberships to encourage repeat business.
Industry Trends Across the Year
See how seasonality affects key sales volume, guest type and order amounts for the
Tours
industry.
What’s your window?
Booking across
Lodging / Service
happen on average
13
days in advance
The most popular booking days for
Lodging / Service
are
Tuesday, Monday, Wednesday
49.52
%
of bookings happen on these days
Knowing when customers book is crucial to building a profile of their needs and wants, and being able to better target them via laser-focused marketing to hit those sweet spots.
What are customers spending?
$
167.37
average order amount
This shows an average change of
+2.19
%
from last year
2
average number of tickets per order
This shows an average change of
+17.65
%
from last year
Consider adding additional activity options as a bundle and upselling add-ons like drinks or merch to boost earnings.
Get ahead of cancellation
Cancellations for
Lodging / Service
experiences happen on average
10
days in advance
Knowing when people are most likely to bail allows you to sharpen your strategies to keep bookings locked in. Try adding in auto email reminders to generate excitement, highlight self-reschedule options and make your policy clear when booking.
Where are your customers clicking?
70.45
%
29.55
%
Locals or Tourists?
%
%
%
Where guests visit you from can affect how you market your tours. For tourists, try expanding your marketing geos, offer bundled activities together or add local recs in your comms. For locals, consider punch passes or memberships to encourage repeat business.
Industry Trends Across the Year
See how seasonality affects key sales volume, guest type and order amounts for the
Lodging / Service
industry.
What’s your window?
Booking across
Lodging / Service
happen on average
18
days in advance
The most popular booking days for
Lodging / Service
are
Monday, Tuesday, Friday
46.23
%
of bookings happen on these days
Knowing when customers book is crucial to building a profile of their needs and wants, and being able to better target them via laser-focused marketing to hit those sweet spots.
What are customers spending?
$
236.69
average order amount
This shows an average change of
+5.56
%
from last year
4.3
average number of tickets per order
This shows an average change of
+19.44
%
from last year
Consider adding additional activity options as a bundle and upselling add-ons like drinks or merch to boost earnings.
Get ahead of cancellation
Cancellations for
Lodging / Service
experiences happen on average
9
days in advance
Knowing when people are most likely to bail allows you to sharpen your strategies to keep bookings locked in. Try adding in auto email reminders to generate excitement, highlight self-reschedule options and make your policy clear when booking.
Where are your customers clicking?
70.24
%
29.76
%
Locals or Tourists?
%
%
%
Where guests visit you from can affect how you market your tours. For tourists, try expanding your marketing geos, offer bundled activities together or add local recs in your comms. For locals, consider punch passes or memberships to encourage repeat business.
Industry Trends Across the Year
See how seasonality affects key sales volume, guest type and order amounts for the
Lodging / Service
industry.
What’s your window?
Booking across
Local Things to Do
happen on average
7
days in advance
The most popular booking days for
Local Things to Do
are
Friday, Wednesday, Saturday
46.48
%
of bookings happen on these days
Knowing when customers book is crucial to building a profile of their needs and wants, and being able to better target them via laser-focused marketing to hit those sweet spots.
What are customers spending?
$
64.34
average order amount
This shows an average change of
-50.39
%
from last year
2.3
average number of tickets per order
This shows an average change of
-20.69
%
from last year
Consider adding additional activity options as a bundle and upselling add-ons like drinks or merch to boost earnings.
Get ahead of cancellation
Cancellations for
Local Things to Do
experiences happen on average
6
days in advance
Knowing when people are most likely to bail allows you to sharpen your strategies to keep bookings locked in. Try adding in auto email reminders to generate excitement, highlight self-reschedule options and make your policy clear when booking.
Where are your customers clicking?
85.15
%
14.85
%
Locals or Tourists?
%
%
%
Where guests visit you from can affect how you market your tours. For tourists, try expanding your marketing geos, offer bundled activities together or add local recs in your comms. For locals, consider punch passes or memberships to encourage repeat business.
Industry Trends Across the Year
See how seasonality affects key sales volume, guest type and order amounts for the
Local Things to Do
industry.
What’s your window?
Booking across
Lodging / Service
happen on average
12
days in advance
The most popular booking days for
Lodging / Service
are
Tuesday, Friday, Monday
45.75
%
of bookings happen on these days
Knowing when customers book is crucial to building a profile of their needs and wants, and being able to better target them via laser-focused marketing to hit those sweet spots.
What are customers spending?
$
91.6
average order amount
This shows an average change of
+5.21
%
from last year
2.3
average number of tickets per order
This shows an average change of
-4.17
%
from last year
Consider adding additional activity options as a bundle and upselling add-ons like drinks or merch to boost earnings.
Get ahead of cancellation
Cancellations for
Lodging / Service
experiences happen on average
-9
days in advance
Knowing when people are most likely to bail allows you to sharpen your strategies to keep bookings locked in. Try adding in auto email reminders to generate excitement, highlight self-reschedule options and make your policy clear when booking.
Where are your customers clicking?
71.59
%
+28.41
%
Locals or Tourists?
%
%
%
Where guests visit you from can affect how you market your tours. For tourists, try expanding your marketing geos, offer bundled activities together or add local recs in your comms. For locals, consider punch passes or memberships to encourage repeat business.
Industry Trends Across the Year
See how seasonality affects key sales volume, guest type and order amounts for the
Lodging / Service
industry.
What’s your window?
Booking across
Local Things to Do
happen on average
7
days in advance
The most popular booking days for
Local Things to Do
are
Saturday, Friday, Thursday
51.21
%
of bookings happen on these days
Knowing when customers book is crucial to building a profile of their needs and wants, and being able to better target them via laser-focused marketing to hit those sweet spots.
What are customers spending?
$
97.72
average order amount
This shows an average change of
+1.07
%
from last year
3.1
average number of tickets per order
This shows an average change of
+0.23
%
from last year
Consider adding additional activity options as a bundle and upselling add-ons like drinks or merch to boost earnings.
Get ahead of cancellation
Cancellations for
Local Things to Do
experiences happen on average
5
days in advance
Knowing when people are most likely to bail allows you to sharpen your strategies to keep bookings locked in. Try adding in auto email reminders to generate excitement, highlight self-reschedule options and make your policy clear when booking.
Where are your customers clicking?
72.68
%
+27.32
%
Locals or Tourists?
%
%
%
Where guests visit you from can affect how you market your tours. For tourists, try expanding your marketing geos, offer bundled activities together or add local recs in your comms. For locals, consider punch passes or memberships to encourage repeat business.
Industry Trends Across the Year
See how seasonality affects key sales volume, guest type and order amounts for the
Local Things to Do
industry.
What’s your window?
Booking across
Food & Drink
happen on average
30
days in advance
The most popular booking days for
Food & Drink
are
Tuesday, Monday, Wednesday
47.59
%
of bookings happen on these days
Knowing when customers book is crucial to building a profile of their needs and wants, and being able to better target them via laser-focused marketing to hit those sweet spots.
What are customers spending?
$
148.37
average order amount
This shows an average change of
-0.23
%
from last year
3.1
average number of tickets per order
This shows an average change of
+3.33
%
from last year
Consider adding additional activity options as a bundle and upselling add-ons like drinks or merch to boost earnings.
Get ahead of cancellation
Cancellations for
Food & Drink
experiences happen on average
22
days in advance
Knowing when people are most likely to bail allows you to sharpen your strategies to keep bookings locked in. Try adding in auto email reminders to generate excitement, highlight self-reschedule options and make your policy clear when booking.
Where are your customers clicking?
64.04
%
+35.96
%
Locals or Tourists?
%
%
%
Where guests visit you from can affect how you market your tours. For tourists, try expanding your marketing geos, offer bundled activities together or add local recs in your comms. For locals, consider punch passes or memberships to encourage repeat business.
Industry Trends Across the Year
See how seasonality affects key sales volume, guest type and order amounts for the
Food & Drink
industry.
What’s your window?
Booking across
Local Things to Do
happen on average
12
days in advance
The most popular booking days for
Local Things to Do
are
Saturday, Friday, Thursday
51.75
%
of bookings happen on these days
Knowing when customers book is crucial to building a profile of their needs and wants, and being able to better target them via laser-focused marketing to hit those sweet spots.
What are customers spending?
$
96.15
average order amount
This shows an average change of
+4.43
%
from last year
3.6
average number of tickets per order
This shows an average change of
+5.88
%
from last year
Consider adding additional activity options as a bundle and upselling add-ons like drinks or merch to boost earnings.
Get ahead of cancellation
Cancellations for
Local Things to Do
experiences happen on average
11
days in advance
Knowing when people are most likely to bail allows you to sharpen your strategies to keep bookings locked in. Try adding in auto email reminders to generate excitement, highlight self-reschedule options and make your policy clear when booking.
Where are your customers clicking?
72.75
%
27.25
%
Locals or Tourists?
%
%
%
Where guests visit you from can affect how you market your tours. For tourists, try expanding your marketing geos, offer bundled activities together or add local recs in your comms. For locals, consider punch passes or memberships to encourage repeat business.
Industry Trends Across the Year
See how seasonality affects key sales volume, guest type and order amounts for the
Local Things to Do
industry.
What’s your window?
Booking across
Classes / Workshops
happen on average
23
days in advance
The most popular booking days for
Classes / Workshops
are
Friday, Wednesday, Tuesday
46.06
%
of bookings happen on these days
Knowing when customers book is crucial to building a profile of their needs and wants, and being able to better target them via laser-focused marketing to hit those sweet spots.
What are customers spending?
$
70.49
average order amount
This shows an average change of
+3.51
%
from last year
2.4
average number of tickets per order
This shows an average change of
-4
%
from last year
Consider adding additional activity options as a bundle and upselling add-ons like drinks or merch to boost earnings.
Get ahead of cancellation
Cancellations for
Classes / Workshops
experiences happen on average
21
days in advance
Knowing when people are most likely to bail allows you to sharpen your strategies to keep bookings locked in. Try adding in auto email reminders to generate excitement, highlight self-reschedule options and make your policy clear when booking.
Where are your customers clicking?
84.96
%
15.04
%
Locals or Tourists?
%
%
%
Where guests visit you from can affect how you market your tours. For tourists, try expanding your marketing geos, offer bundled activities together or add local recs in your comms. For locals, consider punch passes or memberships to encourage repeat business.
Industry Trends Across the Year
See how seasonality affects key sales volume, guest type and order amounts for the
Classes / Workshops
industry.
What’s your window?
Booking across
Food & Drink
happen on average
24
days in advance
The most popular booking days for
Food & Drink
are
Friday, Tuesday, Wednesday
47.56
%
of bookings happen on these days
Knowing when customers book is crucial to building a profile of their needs and wants, and being able to better target them via laser-focused marketing to hit those sweet spots.
What are customers spending?
$
208.23
average order amount
This shows an average change of
-8.74
%
from last year
3.5
average number of tickets per order
This shows an average change of
-2.78
%
from last year
Consider adding additional activity options as a bundle and upselling add-ons like drinks or merch to boost earnings.
Get ahead of cancellation
Cancellations for
Food & Drink
experiences happen on average
37
days in advance
Knowing when people are most likely to bail allows you to sharpen your strategies to keep bookings locked in. Try adding in auto email reminders to generate excitement, highlight self-reschedule options and make your policy clear when booking.
Where are your customers clicking?
56.2
%
43.8
%
Locals or Tourists?
%
%
%
Where guests visit you from can affect how you market your tours. For tourists, try expanding your marketing geos, offer bundled activities together or add local recs in your comms. For locals, consider punch passes or memberships to encourage repeat business.
Industry Trends Across the Year
See how seasonality affects key sales volume, guest type and order amounts for the
Food & Drink
industry.
What’s your window?
Booking across
Food & Drink
happen on average
22
days in advance
The most popular booking days for
Food & Drink
are
Tuesday, Thursday, Friday
47.55
%
of bookings happen on these days
Knowing when customers book is crucial to building a profile of their needs and wants, and being able to better target them via laser-focused marketing to hit those sweet spots.
What are customers spending?
$
120.94
average order amount
This shows an average change of
-7.2
%
from last year
3.4
average number of tickets per order
This shows an average change of
+0.31
%
from last year
Consider adding additional activity options as a bundle and upselling add-ons like drinks or merch to boost earnings.
Get ahead of cancellation
Cancellations for
Food & Drink
experiences happen on average
17
days in advance
Knowing when people are most likely to bail allows you to sharpen your strategies to keep bookings locked in. Try adding in auto email reminders to generate excitement, highlight self-reschedule options and make your policy clear when booking.
Where are your customers clicking?
74.39
%
25.61
%
Locals or Tourists?
%
%
%
Where guests visit you from can affect how you market your tours. For tourists, try expanding your marketing geos, offer bundled activities together or add local recs in your comms. For locals, consider punch passes or memberships to encourage repeat business.
Industry Trends Across the Year
See how seasonality affects key sales volume, guest type and order amounts for the
Food & Drink
industry.
What’s your window?
Booking across
Classes / Workshops
happen on average
13
days in advance
The most popular booking days for
Classes / Workshops
are
Wednesday, Monday, Tuesday
48.73
%
of bookings happen on these days
Knowing when customers book is crucial to building a profile of their needs and wants, and being able to better target them via laser-focused marketing to hit those sweet spots.
What are customers spending?
$
91.96
average order amount
This shows an average change of
+22.24
%
from last year
1.6
average number of tickets per order
This shows an average change of
-5.88
%
from last year
Consider adding additional activity options as a bundle and upselling add-ons like drinks or merch to boost earnings.
Get ahead of cancellation
Cancellations for
Classes / Workshops
experiences happen on average
10
days in advance
Knowing when people are most likely to bail allows you to sharpen your strategies to keep bookings locked in. Try adding in auto email reminders to generate excitement, highlight self-reschedule options and make your policy clear when booking.
Where are your customers clicking?
87.65
%
12.35
%
Locals or Tourists?
%
%
%
Where guests visit you from can affect how you market your tours. For tourists, try expanding your marketing geos, offer bundled activities together or add local recs in your comms. For locals, consider punch passes or memberships to encourage repeat business.
Industry Trends Across the Year
See how seasonality affects key sales volume, guest type and order amounts for the
Classes / Workshops
industry.
What’s your window?
Booking across
Attractions - Outdoor
happen on average
6
days in advance
The most popular booking days for
Attractions - Outdoor
are
Friday, Thursday, Wednesday
48.49
%
of bookings happen on these days
Knowing when customers book is crucial to building a profile of their needs and wants, and being able to better target them via laser-focused marketing to hit those sweet spots.
What are customers spending?
$
54.63
average order amount
This shows an average change of
-49.78
%
from last year
3.1
average number of tickets per order
This shows an average change of
+14.81
%
from last year
Consider adding additional activity options as a bundle and upselling add-ons like drinks or merch to boost earnings.
Get ahead of cancellation
Cancellations for
Attractions - Outdoor
experiences happen on average
16
days in advance
Knowing when people are most likely to bail allows you to sharpen your strategies to keep bookings locked in. Try adding in auto email reminders to generate excitement, highlight self-reschedule options and make your policy clear when booking.
Where are your customers clicking?
74.79
%
25.21
%
Locals or Tourists?
%
%
%
Where guests visit you from can affect how you market your tours. For tourists, try expanding your marketing geos, offer bundled activities together or add local recs in your comms. For locals, consider punch passes or memberships to encourage repeat business.
Industry Trends Across the Year
See how seasonality affects key sales volume, guest type and order amounts for the
Attractions - Outdoor
industry.
What’s your window?
Booking across
Attractions - Outdoor
happen on average
27
days in advance
The most popular booking days for
Attractions - Outdoor
are
Friday, Wednesday, Saturday
46.05
%
of bookings happen on these days
Knowing when customers book is crucial to building a profile of their needs and wants, and being able to better target them via laser-focused marketing to hit those sweet spots.
What are customers spending?
$
228.6
average order amount
This shows an average change of
+27.28
%
from last year
4.1
average number of tickets per order
This shows an average change of
+7.89
%
from last year
Consider adding additional activity options as a bundle and upselling add-ons like drinks or merch to boost earnings.
Get ahead of cancellation
Cancellations for
Attractions - Outdoor
experiences happen on average
19
days in advance
Knowing when people are most likely to bail allows you to sharpen your strategies to keep bookings locked in. Try adding in auto email reminders to generate excitement, highlight self-reschedule options and make your policy clear when booking.
Where are your customers clicking?
82.53
%
17.47
%
Locals or Tourists?
%
%
%
Where guests visit you from can affect how you market your tours. For tourists, try expanding your marketing geos, offer bundled activities together or add local recs in your comms. For locals, consider punch passes or memberships to encourage repeat business.
Industry Trends Across the Year
See how seasonality affects key sales volume, guest type and order amounts for the
Attractions - Outdoor
industry.
What’s your window?
Booking across
Attractions - Indoor
happen on average
5
days in advance
The most popular booking days for
Attractions - Indoor
are
Saturday, Friday, Sunday
54.81
%
of bookings happen on these days
Knowing when customers book is crucial to building a profile of their needs and wants, and being able to better target them via laser-focused marketing to hit those sweet spots.
What are customers spending?
$
111.67
average order amount
This shows an average change of
+0.82
%
from last year
2.9
average number of tickets per order
This shows an average change of
+0.12
%
from last year
Consider adding additional activity options as a bundle and upselling add-ons like drinks or merch to boost earnings.
Get ahead of cancellation
Cancellations for
Attractions - Indoor
experiences happen on average
6
days in advance
Knowing when people are most likely to bail allows you to sharpen your strategies to keep bookings locked in. Try adding in auto email reminders to generate excitement, highlight self-reschedule options and make your policy clear when booking.
Where are your customers clicking?
87.77
%
12.23
%
Locals or Tourists?
%
%
%
Where guests visit you from can affect how you market your tours. For tourists, try expanding your marketing geos, offer bundled activities together or add local recs in your comms. For locals, consider punch passes or memberships to encourage repeat business.
Industry Trends Across the Year
See how seasonality affects key sales volume, guest type and order amounts for the
Attractions - Indoor
industry.
What’s your window?
Booking across
Attractions - Outdoor
happen on average
19
days in advance
The most popular booking days for
Attractions - Outdoor
are
Monday, Saturday, Friday
44.8
%
of bookings happen on these days
Knowing when customers book is crucial to building a profile of their needs and wants, and being able to better target them via laser-focused marketing to hit those sweet spots.
What are customers spending?
$
90.27
average order amount
This shows an average change of
-2.75
%
from last year
3.1
average number of tickets per order
This shows an average change of
-6.06
%
from last year
Consider adding additional activity options as a bundle and upselling add-ons like drinks or merch to boost earnings.
Get ahead of cancellation
Cancellations for
Attractions - Outdoor
experiences happen on average
37
days in advance
Knowing when people are most likely to bail allows you to sharpen your strategies to keep bookings locked in. Try adding in auto email reminders to generate excitement, highlight self-reschedule options and make your policy clear when booking.
Where are your customers clicking?
72.76
%
27.24
%
Locals or Tourists?
%
%
%
Where guests visit you from can affect how you market your tours. For tourists, try expanding your marketing geos, offer bundled activities together or add local recs in your comms. For locals, consider punch passes or memberships to encourage repeat business.
Industry Trends Across the Year
See how seasonality affects key sales volume, guest type and order amounts for the
Attractions - Outdoor
industry.
What’s your window?
Booking across
Attractions - Indoor
happen on average
13
days in advance
The most popular booking days for
Attractions - Indoor
are
Saturday, Friday, Wednesday
49.19
%
of bookings happen on these days
Knowing when customers book is crucial to building a profile of their needs and wants, and being able to better target them via laser-focused marketing to hit those sweet spots.
What are customers spending?
$
69.65
average order amount
This shows an average change of
+9.69
%
from last year
2.8
average number of tickets per order
This shows an average change of
-15.15
%
from last year
Consider adding additional activity options as a bundle and upselling add-ons like drinks or merch to boost earnings.
Get ahead of cancellation
Cancellations for
Attractions - Indoor
experiences happen on average
7
days in advance
Knowing when people are most likely to bail allows you to sharpen your strategies to keep bookings locked in. Try adding in auto email reminders to generate excitement, highlight self-reschedule options and make your policy clear when booking.
Where are your customers clicking?
82
%
18
%
Locals or Tourists?
%
%
%
Where guests visit you from can affect how you market your tours. For tourists, try expanding your marketing geos, offer bundled activities together or add local recs in your comms. For locals, consider punch passes or memberships to encourage repeat business.
Industry Trends Across the Year
See how seasonality affects key sales volume, guest type and order amounts for the
Attractions - Indoor
industry.
What’s your window?
Booking across
Attractions - Indoor
happen on average
27
days in advance
The most popular booking days for
Attractions - Indoor
are
Saturday, Friday, Thursday
50.82
%
of bookings happen on these days
Knowing when customers book is crucial to building a profile of their needs and wants, and being able to better target them via laser-focused marketing to hit those sweet spots.
What are customers spending?
$
58.09
average order amount
This shows an average change of
-5.48
%
from last year
3.3
average number of tickets per order
This shows an average change of
-15.38
%
from last year
Consider adding additional activity options as a bundle and upselling add-ons like drinks or merch to boost earnings.
Get ahead of cancellation
Cancellations for
Attractions - Indoor
experiences happen on average
16
days in advance
Knowing when people are most likely to bail allows you to sharpen your strategies to keep bookings locked in. Try adding in auto email reminders to generate excitement, highlight self-reschedule options and make your policy clear when booking.
Where are your customers clicking?
63.54
%
36.46
%
Locals or Tourists?
%
%
%
Where guests visit you from can affect how you market your tours. For tourists, try expanding your marketing geos, offer bundled activities together or add local recs in your comms. For locals, consider punch passes or memberships to encourage repeat business.
Industry Trends Across the Year
See how seasonality affects key sales volume, guest type and order amounts for the
Attractions - Indoor
industry.
What’s your window?
Booking across
Aerial Activities
happen on average
43
days in advance
The most popular booking days for
Aerial Activities
are
Friday, Monday, Thursday
46.36
%
of bookings happen on these days
Knowing when customers book is crucial to building a profile of their needs and wants, and being able to better target them via laser-focused marketing to hit those sweet spots.
What are customers spending?
$
235.16
average order amount
This shows an average change of
-11.94
%
from last year
2.3
average number of tickets per order
This shows an average change of
+0.15
%
from last year
Consider adding additional activity options as a bundle and upselling add-ons like drinks or merch to boost earnings.
Get ahead of cancellation
Cancellations for
Aerial Activities
experiences happen on average
17
days in advance
Knowing when people are most likely to bail allows you to sharpen your strategies to keep bookings locked in. Try adding in auto email reminders to generate excitement, highlight self-reschedule options and make your policy clear when booking.
Where are your customers clicking?
69.06
%
30.94
%
Locals or Tourists?
%
%
%
Where guests visit you from can affect how you market your tours. For tourists, try expanding your marketing geos, offer bundled activities together or add local recs in your comms. For locals, consider punch passes or memberships to encourage repeat business.
Industry Trends Across the Year
See how seasonality affects key sales volume, guest type and order amounts for the
Aerial Activities
industry.
What’s your window?
Booking across
Aerial Activities
happen on average
13
days in advance
The most popular booking days for
Aerial Activities
are
Saturday, Friday, Sunday
49.14
%
of bookings happen on these days
Knowing when customers book is crucial to building a profile of their needs and wants, and being able to better target them via laser-focused marketing to hit those sweet spots.
What are customers spending?
$
346.27
average order amount
This shows an average change of
+20.85
%
from last year
2.4
average number of tickets per order
This shows an average change of
+0.34
%
from last year
Consider adding additional activity options as a bundle and upselling add-ons like drinks or merch to boost earnings.
Get ahead of cancellation
Cancellations for
Aerial Activities
experiences happen on average
4
days in advance
Knowing when people are most likely to bail allows you to sharpen your strategies to keep bookings locked in. Try adding in auto email reminders to generate excitement, highlight self-reschedule options and make your policy clear when booking.
Where are your customers clicking?
67.24
%
32.76
%
Locals or Tourists?
%
%
%
Where guests visit you from can affect how you market your tours. For tourists, try expanding your marketing geos, offer bundled activities together or add local recs in your comms. For locals, consider punch passes or memberships to encourage repeat business.
Industry Trends Across the Year
See how seasonality affects key sales volume, guest type and order amounts for the
Aerial Activities
industry.
What’s your window?
Booking across
Aerial Activities
happen on average
21
days in advance
The most popular booking days for
Aerial Activities
are
Monday, Tuesday, Wednesday
47.71
%
of bookings happen on these days
Knowing when customers book is crucial to building a profile of their needs and wants, and being able to better target them via laser-focused marketing to hit those sweet spots.
What are customers spending?
$
401.69
average order amount
This shows an average change of
+16.46
%
from last year
3.4
average number of tickets per order
This shows an average change of
+0.23
%
from last year
Consider adding additional activity options as a bundle and upselling add-ons like drinks or merch to boost earnings.
Get ahead of cancellation
Cancellations for
Aerial Activities
experiences happen on average
19
days in advance
Knowing when people are most likely to bail allows you to sharpen your strategies to keep bookings locked in. Try adding in auto email reminders to generate excitement, highlight self-reschedule options and make your policy clear when booking.
Where are your customers clicking?
34.2
%
65.8
%
Locals or Tourists?
%
%
%
Where guests visit you from can affect how you market your tours. For tourists, try expanding your marketing geos, offer bundled activities together or add local recs in your comms. For locals, consider punch passes or memberships to encourage repeat business.
Industry Trends Across the Year
See how seasonality affects key sales volume, guest type and order amounts for the
Aerial Activities
industry.
What’s your window?
Booking across
Adventure
happen on average
15
days in advance
The most popular booking days for
Adventure
are
Saturday, Friday, Monday
44.66
%
of bookings happen on these days
Knowing when customers book is crucial to building a profile of their needs and wants, and being able to better target them via laser-focused marketing to hit those sweet spots.
What are customers spending?
$
191.53
average order amount
This shows an average change of
+7.24
%
from last year
3.1
average number of tickets per order
This shows an average change of
+3.33
%
from last year
Consider adding additional activity options as a bundle and upselling add-ons like drinks or merch to boost earnings.
Get ahead of cancellation
Cancellations for
Adventure
experiences happen on average
9
days in advance
Knowing when people are most likely to bail allows you to sharpen your strategies to keep bookings locked in. Try adding in auto email reminders to generate excitement, highlight self-reschedule options and make your policy clear when booking.
Where are your customers clicking?
51.94
%
48.06
%
Locals or Tourists?
%
%
%
Where guests visit you from can affect how you market your tours. For tourists, try expanding your marketing geos, offer bundled activities together or add local recs in your comms. For locals, consider punch passes or memberships to encourage repeat business.
Industry Trends Across the Year
See how seasonality affects key sales volume, guest type and order amounts for the
Adventure
industry.
What’s your window?
Booking across
Adventure
happen on average
12
days in advance
The most popular booking days for
Adventure
are
Saturday, Friday, Sunday
46.02
%
of bookings happen on these days
Knowing when customers book is crucial to building a profile of their needs and wants, and being able to better target them via laser-focused marketing to hit those sweet spots.
What are customers spending?
$
159.52
average order amount
This shows an average change of
+13.42
%
from last year
3.5
average number of tickets per order
This shows an average change of
+2.94
%
from last year
Consider adding additional activity options as a bundle and upselling add-ons like drinks or merch to boost earnings.
Get ahead of cancellation
Cancellations for
Adventure
experiences happen on average
13
days in advance
Knowing when people are most likely to bail allows you to sharpen your strategies to keep bookings locked in. Try adding in auto email reminders to generate excitement, highlight self-reschedule options and make your policy clear when booking.
Where are your customers clicking?
61.45
%
38.55
%
Locals or Tourists?
%
%
%
Where guests visit you from can affect how you market your tours. For tourists, try expanding your marketing geos, offer bundled activities together or add local recs in your comms. For locals, consider punch passes or memberships to encourage repeat business.
Industry Trends Across the Year
See how seasonality affects key sales volume, guest type and order amounts for the
Adventure
industry.
What’s your window?
Booking across
Adventure
happen on average
18
days in advance
The most popular booking days for
Adventure
are
Friday, Thursday, Saturday
45.46
%
of bookings happen on these days
Knowing when customers book is crucial to building a profile of their needs and wants, and being able to better target them via laser-focused marketing to hit those sweet spots.
What are customers spending?
$
154.33
average order amount
This shows an average change of
+0.32
%
from last year
3.3
average number of tickets per order
This shows an average change of
-2.94
%
from last year
Consider adding additional activity options as a bundle and upselling add-ons like drinks or merch to boost earnings.
Get ahead of cancellation
Cancellations for
Adventure
experiences happen on average
11
days in advance
Knowing when people are most likely to bail allows you to sharpen your strategies to keep bookings locked in. Try adding in auto email reminders to generate excitement, highlight self-reschedule options and make your policy clear when booking.
Where are your customers clicking?
64.67
%
35.33
%
Locals or Tourists?
%
%
%
Where guests visit you from can affect how you market your tours. For tourists, try expanding your marketing geos, offer bundled activities together or add local recs in your comms. For locals, consider punch passes or memberships to encourage repeat business.
Industry Trends Across the Year
See how seasonality affects key sales volume, guest type and order amounts for the
Adventure
industry.

Request Free Demo
Operators on Peek see an average 30% boost in revenue


